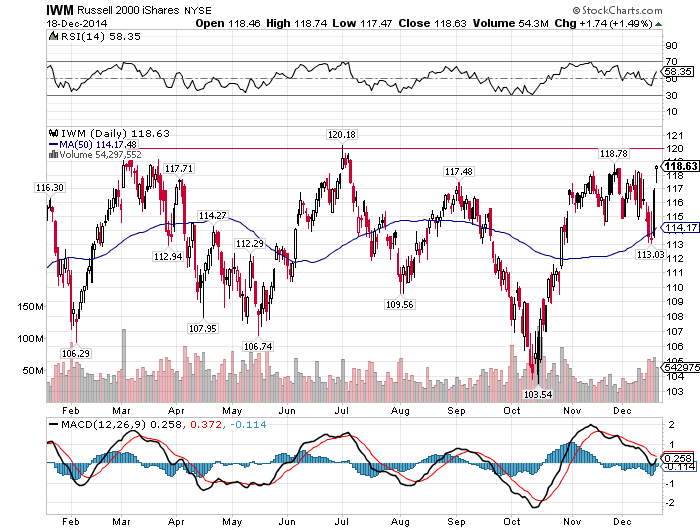
On the iwm weekly it looks like a flat top at $120ish with a broadening bottom. Breakout above has a target of $132ish. Downside target of low $90s.
 the daily chart is sloppy and has a little more to reach the top line. Should be some resistance above. I’m hoping for a test of the upper line then pullback to $117s to clean up the gap and then break out into $120s. But a clear break into $120s and it may not look back.
If it can’t break out then need to wait and see.
http://thepatternsite.com/rabfd.html